Theory of Demand Class 11 | Change in Demand | Chapter 5 | Class 11 |
Table of Contents
THEORY OF DEMAND CLASS 11, CHAPTER 5 | ECONOMICS
Demand
Demand refers to different possible quantities of a commodity that the consumer is ready to buy at different possible price of that commodity.
Quantity demanded – Specific quantity to be purchased against a specific price of the commodity.
Demand schedule – It is a table showing all the quantities of a commodity that buyer is ready to buy at different prices at a point of time. It is of two types: Individual demand schedule and Market demand schedule.
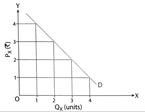
- Individual demand – It is a table showing all the quantities of a commodity and single buyer is ready to buy at different price at a point of time.
| Px | Q.Dx |
| 1 | 4 |
| 2 | 3 |
| 3 | 2 |
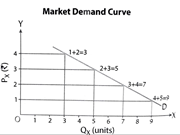
- Market demand – It is a table showing all the quantities of a commodity that all buyers are ready to buy at different price at a point of time.
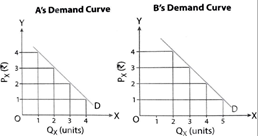
| Mr. A | Mr. B | Market demand (A+B) | |
| Px | QD (A) | QD (B) | QD (A+B) |
| 1 | 4 | 5 | 9 |
| 2 | 3 | 4 | 7 |
| 3 | 2 | 3 | 5 |
Demand Curve – It is a diagrammatic representation showing all the quantities of a commodity that buyer is ready to buy at different price at a point of time. It is of two types: Individual demand curve and Market demand curve.
- Individual demand – It is a diagrammatic representation showing all the quantities of a commodity that a single buyer is ready to buy at different price at a point of time.
Market demand – It is diagrammatic representation showing all the quantities of a commodity that all buyers are ready to buy at different price at a point of time.
Demand function – It shows functional relationship between demand and its determinants. It is of two types: Individual demand function and Market demand function.
- Individual demand – It shows relationship between demand by a single consumer and its various determinants.
Dx = f(Px, Pr, Y, T, E)
Px – Price of the commodity
Pr – Price of related goods
Y – Income of consumer
T – Taste and preference of consumer
E – Expectation of consumer.
- Market demand – It shows relationship between demand by all consumer and its various determinants.
Dx = f(Px, Pr, Y, T, E, N, Yd, G)
Px – Price of the commodity
Pr – Price of related goods
Y – Income of consumer
T – Taste and preference of consumer
E – Expectation of consumer.
N – Population’s size
Yd – Distribution of income
G – Government’s policy
RELATED
Various Determinants
1) Price of the commodity (Px) – It is also known as law of demand. It states that other things being constant, when price of the commodity rises, the demand contracts (falls) and when price of the commodity falls, the demand extends (rises). Price of the commodity and its demand has inverse relationship.
2) Price of related goods (Pr) – It is also known as cross price effects. Goods are said to be related when change in price of one good X brings change in the demand of good Y. For example, increase in the price of tea, demand for coffee increases. Related goods are of two types:
- Substitute goods – These are the goods which can be substituted for each other. For example, Tea and coffee, increase in price of one will cause increase in demand of other.
- Complimentary goods – These are those goods which complete the demand for each other and demanded together. For example, car and petrol.
3) Income of consumer – Demand for a commodity also depends upon income of the consumer, other things being constant.
- Normal goods – These are those goods in case of which there is positive relation between income and quantity demanded. Quantity demanded increases in response to increase in consumer’s income and vice versa, other things remaining constant.
In case of normal goods, income effect is positive. When income increases, demand curve shifts rightwards and when income decreases, demand curve shifts leftwards.
- Inferior goods – There is negative or inverse relationship between income and quantity demanded. Other things remaining constant, quantity demanded decreases in response to increase in consumer’s income and vice versa. When income increases, demand curve shifts leftwards and when income decreases, demand curve shifts rightwards.
4) Taste and preference – Individual taste and preference affects demand of goods and services. Taste and preference of the consumer are influenced by advertisement, climate, change in fashion etc. Demand increases due to favourable change in taste and preference. On the other hand, demand decreases due to unfavourable change in taste and preference.
5) Expectations – If the consumer expects that the price in the future will rise then he will buy more quantity in present at the existing price and vice versa. Similarly, if the consumer expects an increase in income in the future then he will buy more quantity in present at the existing price and vice versa
6) Population size – Increase in population means increase in the number of buyers, so demand increases and demand curve shifts forward. Decrease in population means decrease in number of buyers, so demand falls and demand curve shifts backward.
7) Distribution of income – If income and wealth of the nation is equally distributed then there will be more demand for goods and unequal distribution of income causes a fall in the quantity demanded.If redistribution of income increases unequally, the demand for luxury goods is expected to rise. A fall in income of poor people may compel them to shift from normal to inferior goods.
8) Government policies – If government policies are favourable then demand of goods and services rises and demand curve shifts forward. If government policies are unfavourable then demand falls and demand curve shifts backwards.
The Law Of Demand
The law of demand states that other things being constant, there is an inverse relationship between quantity demanded and own price of the commodity. With a rise in own price of commodity, its demand contracts and with a fall in own price of commodity, its demand extends.
Law of demand holds good when other things remain constant.
Assumptions of the law of Demand
- The price of related goods does not change.
- No change in expectation of consumer
- No change in income of consumer
- Taste and preference of consumer remain constant.
Exception of Law of Demand
- Giffen goods – Giffen goods are special type of inferior gods, where price effect is positive and income effect is negative, the law of demand does not apply with giffen goods,
- Veblen / conspicuous goods – The exception relates to certain prestige goods used as status symbol like luxury goods, diamonds, antiques etc. These goods are demanded by rich section of society.
- Necessity goods – The law of demand does not apply in case of necessity goods like salt, milk, food grains etc.
- Illusion of buyers – When a consumer judges irrationally that if price rises, then quality of goods will be better, he buys more. The law of demand in such case fails.
- Emergencies – The law of demand fails in case of emergencies like war, natural calamity etc.
Why does law of demand operate?
Why is slope of demand curve id downwards?
Why is there inverse relationship between price and demand?
The following factors are responsible for the operation of the law of demand:
- Law of diminishing marginal utility – As consumption of a commodity increases, marginal utility of each successive unit goes on diminishing. Accordingly, for every additional utility consumer is willing to pay less and less price.
- Income effect – It refers to change in demand when there is change in income of the consumer due to fall in price. When price of commodity falls, consumer’s real income increases, so he demands more.
- Substitution effect – It refers to substitution of one commodity foe the other when it becomes relatively cheaper.
- Change in number of buyers – When price falls, new consumers are attracted who can now afford to buy it and thus demand expands.
- Different uses – Goods like milk, steel, electricity etc can be put to several uses. When prices of such goods falls, its uses increases, so demand rises.
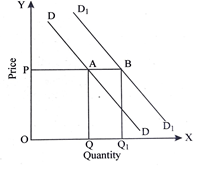
Change in Demand
It refers to increase or decrease in demand in response to change in determinants of demand other than price of the commodity. It is basically shift in demand curve. It is classified in two types: Increase in demand and decrease in demand. It is caused due to change in determinants other than price of commodity.
| Price | Quantity demanded |
| 10 | 100 |
| 10 | 150 |
| 10 | 50 |
Change in Quantity Demanded
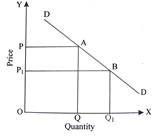
It refers to extension or contraction in quantity demanded in response to rise or fall in its price, other things remain constant. It is also known as movement along a demand curve. It is classified in two types: Extension of demand and Contraction of demand. It is caused due to price factor only.
| Price | Quantity Demanded |
| 10 | 100 |
| 5 | 150 |
| 15 | 50 |
Do share this post if you liked the notes of Theory of Demand Class 11 Economics. For more updates, keep logging on BrainyLads

Consumer Equilibrium Utility Analysis Class 11 | Chapter 3 | Economics |

Central Problem of An Economy Class 11 | Chapter 2 | Microeconomics |

Amazing notes by brainylads thanks for providing everyone……